
 Following Arduino-based Solar PV and Hot water monitoring and logging post the various hardware and parts of the software have been installed, built and written.
After two busy weekends working on the project, the Arduino board is now sending sensor data for the installed temperature sensors to one of our web servers every minute and this is saved onto a SQL 2008 R2 database ready for processing either by a custom website energy dashboard or JSON data feeds for an iPad app we are planning to build once everything else is complete.
The initial plan was to save the sensor data every 5 seconds onto an SD card on the Arduino Ethernet shield but this proved to be a problem when trying to load the saved files via Arudino’s HTTP server which was much too slow to be used.
After looking at various options we decided to go with the following data storage and display options:
Input Sensors
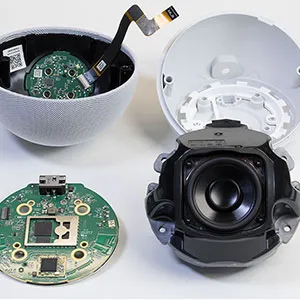
Temperature sensors using MCP9801 ICs with custom small PCBs with sensors installed on the water collector, top of water cylinder, solar return pipe and also one to monitor the battery temperatures.
Low voltage current sensing using 30 amp rated ACS712 Current Sensor Modules on the PV panel output, invert input and 12V output to the low voltage circuits/lighting in the house.
Voltage sensing using a voltage divider for the low voltage PV system and batteries and a transformer-based system for measuring the mains electric supply
Mains voltage current sensing using an inductance system with code and circuit design based on the OpenEnergyMonitor system.
Water pump running sensor using an optoisolated sensor.
Data Logging / Processing
Arduino Mega board with ATmega1280 processor
Arduino Ethernet shield
Custom Arduino shield with a real-time clock and header pins for all the sensor inputs.
Processing the sensor data
The Arduino sketch uses the real-time clock data to save the sensor data every 15 seconds into an internal variable array and once every minute this is sent via an HTTP POST to a processing page located on one of our web servers. The ASP.net page checks all the data is valid and then inserts this into an MS SQL 2008 database.
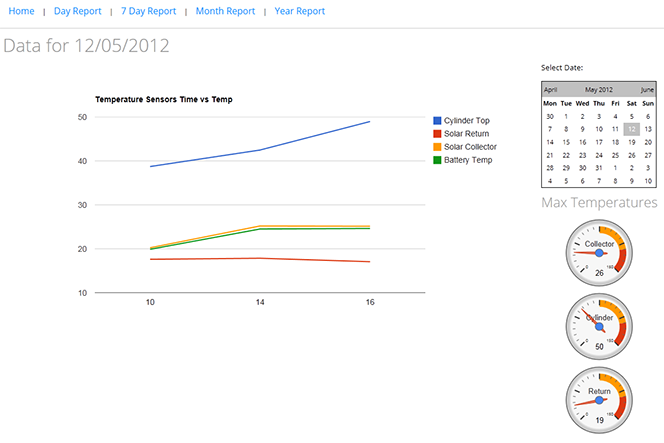
Once the data is on the server it can be used and filtered in many ways to show either near real-time reports or historic data.
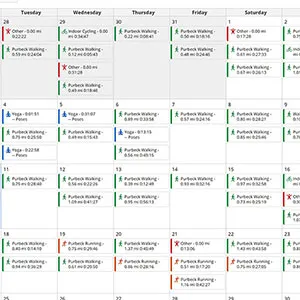
I am planning to use Google's charts to format the data for online use as shown on the mockup below:
We now have a date for the new roof to be fitted and once this is installed and the new solar hot water panel has been fitted and also the new higher power PV panels, we will continue working on the logging system and I will post the Arduino sketch for the data processing to a new blog post.

Comments