
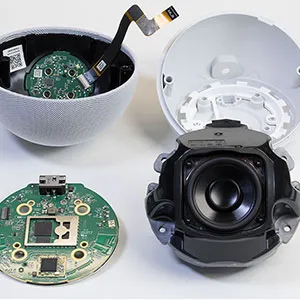
It has now been just over 12 months since we installed our Raspberry Pi solar data logger system on the house and it has been uploading temperature readings, battery voltage and current readings every minute, 24 hours a day, 7 days a week.
The huge amount of data accumulated in the past year has given us a good insight into the energy we use as a household and has prompted us to use more low-energy appliances and also switch completely to using LED lighting in the house and garden which has greatly reduced the load on our mains inverter which powers most of the household lighting.
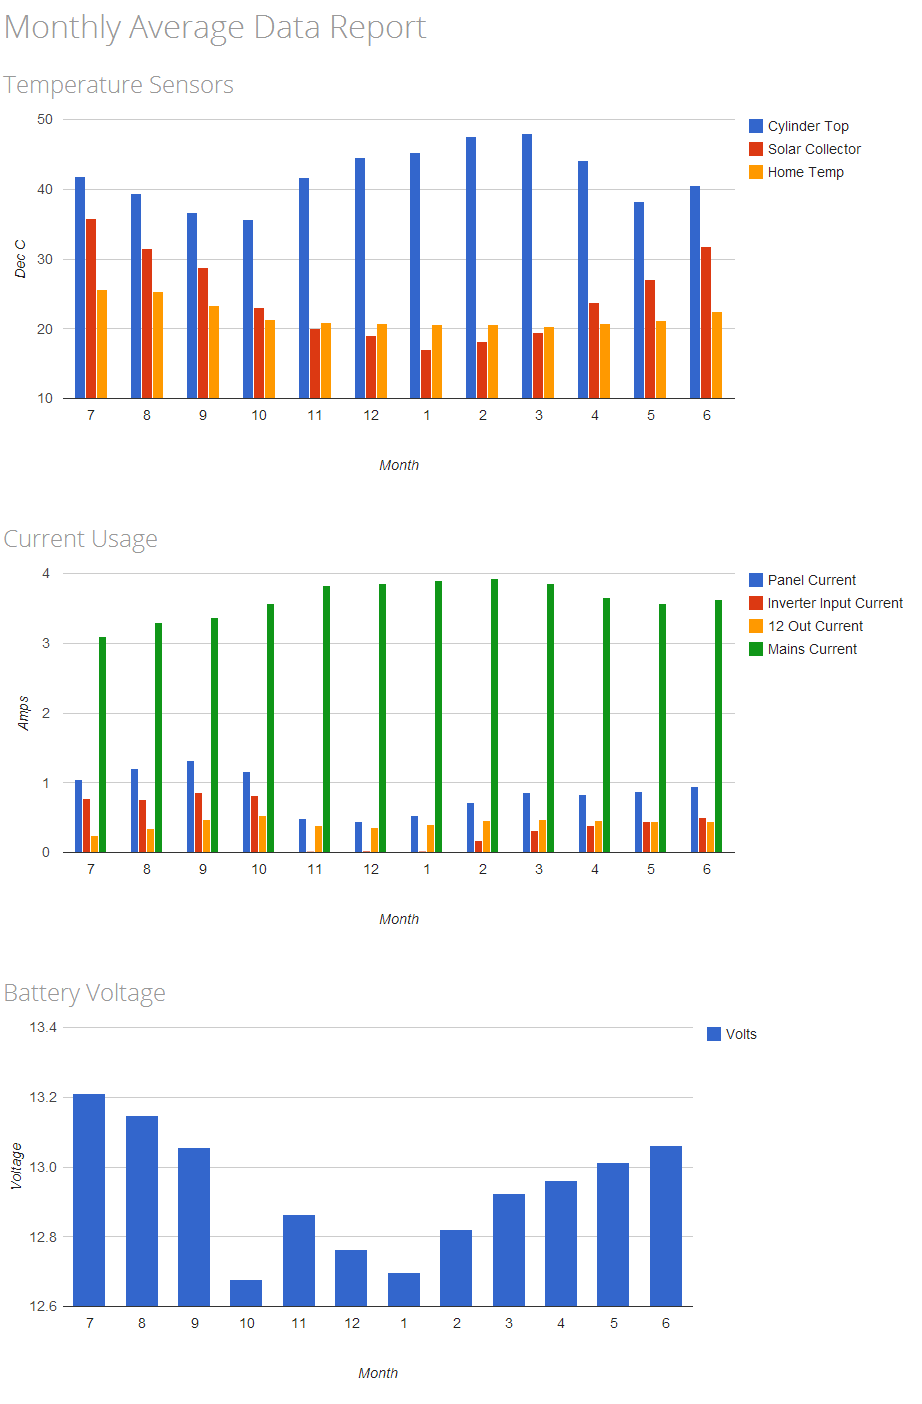
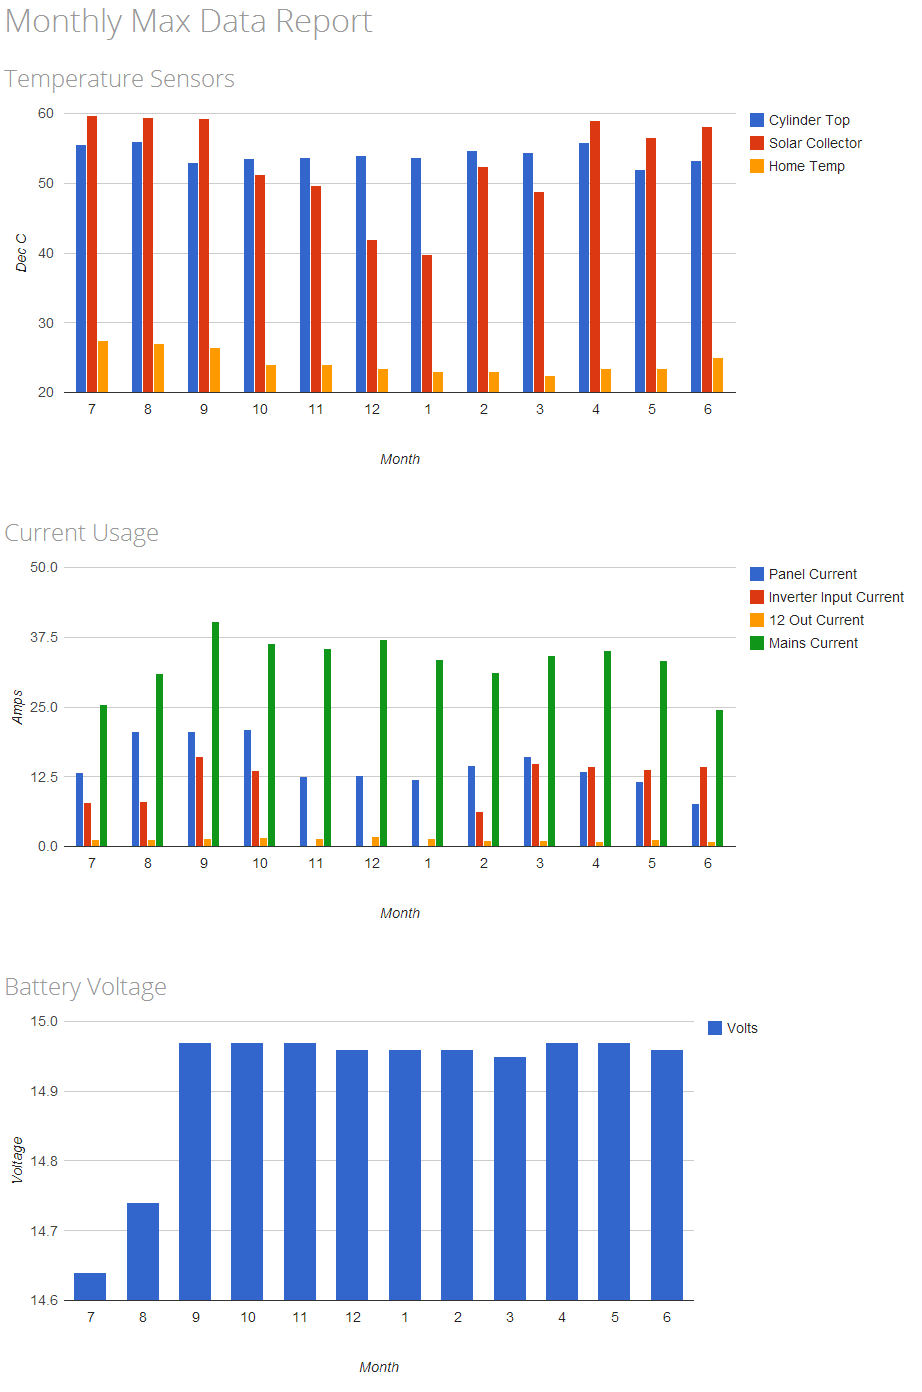
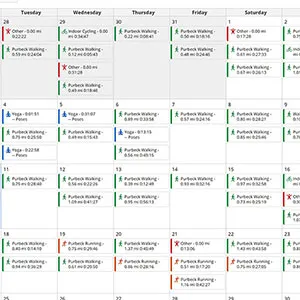
The reports below from the data logger show that in the summer months we get on average 3x more solar PV energy than the winter months and the solar thermal hot water panel produces around 2x more energy in the summer months with a maximum water tank temperature of around 55 deg C at the peak.
Our gas usage which normally heats the water and is used for cooking has had a huge drop during the summer months and this resulted in a 70% smaller gas bill for the spring/summer billing periods.
Click on the images below to view full-size reports.
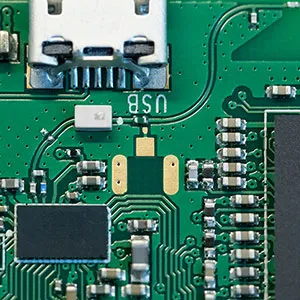
Now we have a lot more experience in surface mount components and building circuits with smaller components, we are planning to completely redesign the entire logging and 12v distribution system so all the 12v PV energy is distributed via a new board with built-in current logging on all output channels and also low voltage cut-off built onto each channel as we currently have on the mains inverter output.
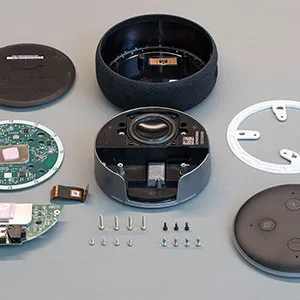
We also plan to install more temperature sensors on the solar thermal system so we can monitor the temperatures both going into and out of the hot water cylinder.
On the mains electricity logging, we are planning to install current sensors (CT) to each of the circuits in the house so we can monitor each one and record both average and peak values.


Comments