
In November of last year, we finished work on our Raspberry Pi based solar data logger, a part of our ongoing smart home project that we have been working on for several years now. The solar logger monitors all of the energy usage for the solar panels and hot water system in the house but one thing it does not monitor is how much electricity and gas we use from the national grid. The previous solar logger which we replaced measured the mains electricity current usage using an iSnail current monitor which gives a 0-5V output for 0-100A AC and we read that voltage using an ADC. As the new solar logger did not have this functionality we decided to design a new data logger that would measure not only the mains current usage but also keep track of the electric meter and gas meter so we can easily see how much energy we are using in the house.
The new mains energy monitor was designed to be a standalone box that would be powered from the mains and have sensors for the mains current, electric meter and gas meter. As we didn’t want to run any more wires around the house we also decided to make it wireless connecting to our network over Wi-Fi.
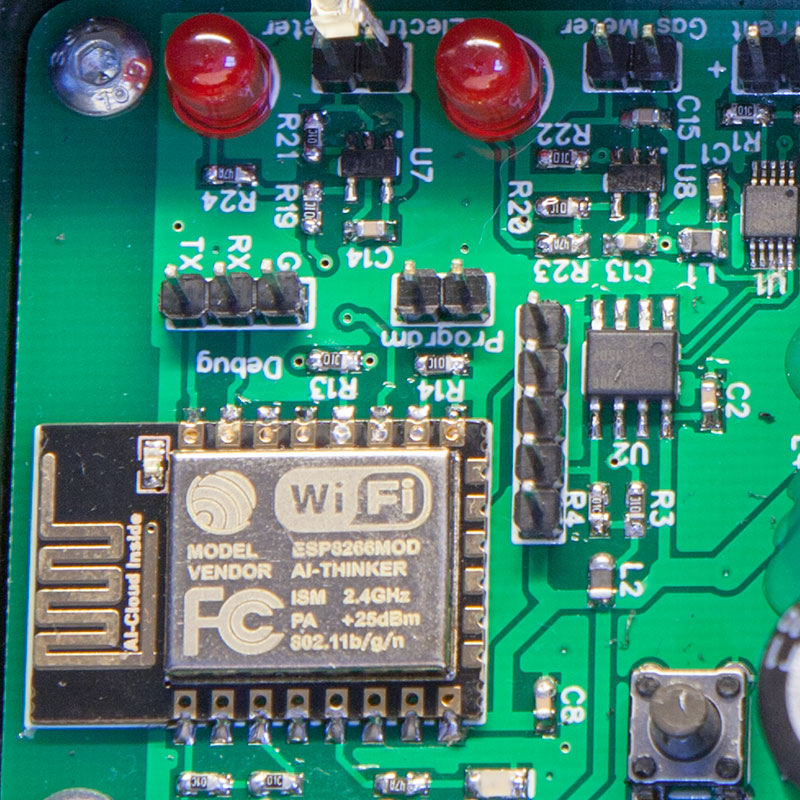
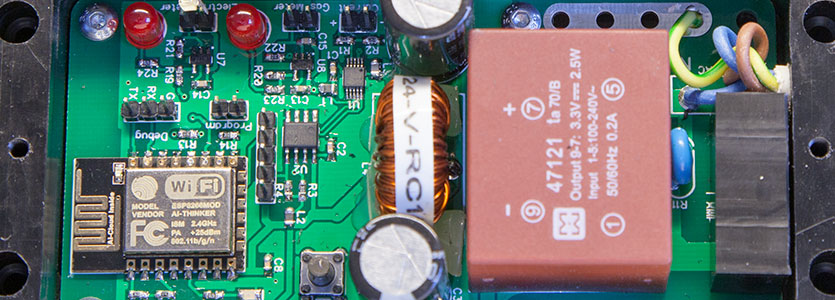
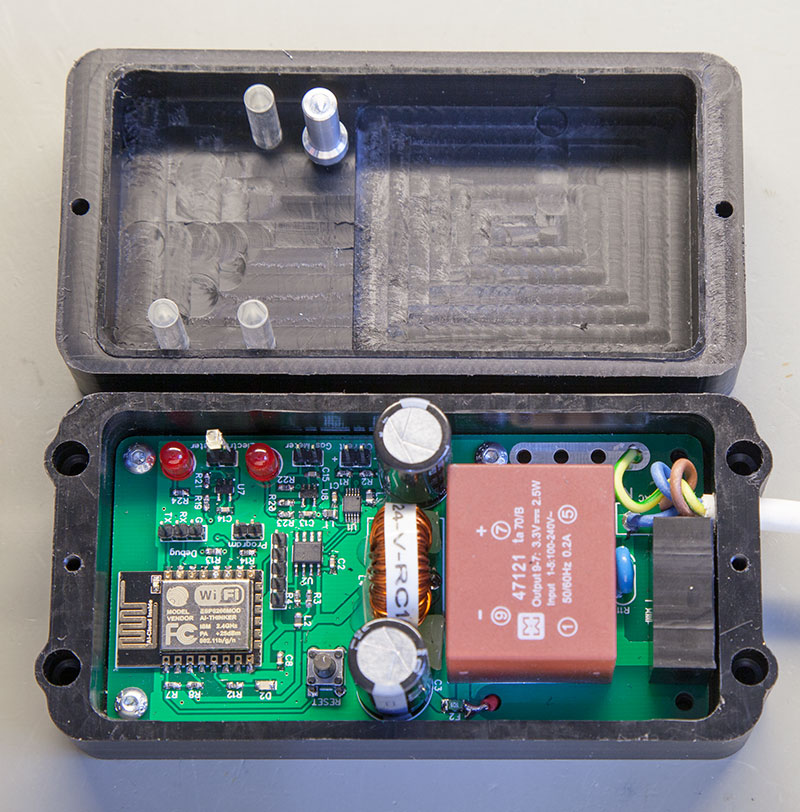
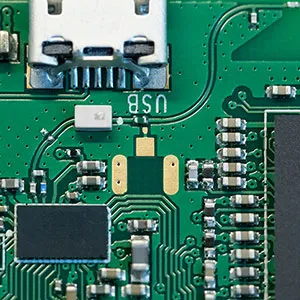
The data logger is based around one of the ESP-12 ESP8266 Wi-Fi modules which have become popular with the electronics community over the last few months. We chose an ESP8266 module because it is a self-contained device that can easily be integrated with the sensors we needed to use and has Arduino library support making the software development easier. To power the data logger we used a 2.5W AC/DC switch mode power supply from Myrra.
As the data logger would be sat next to the electric meter and surrounded by mains cables we added an LC filter with two 4700uF capacitors and a 1mH inductor to smooth out any 50Hz noise on the 3.3V output.
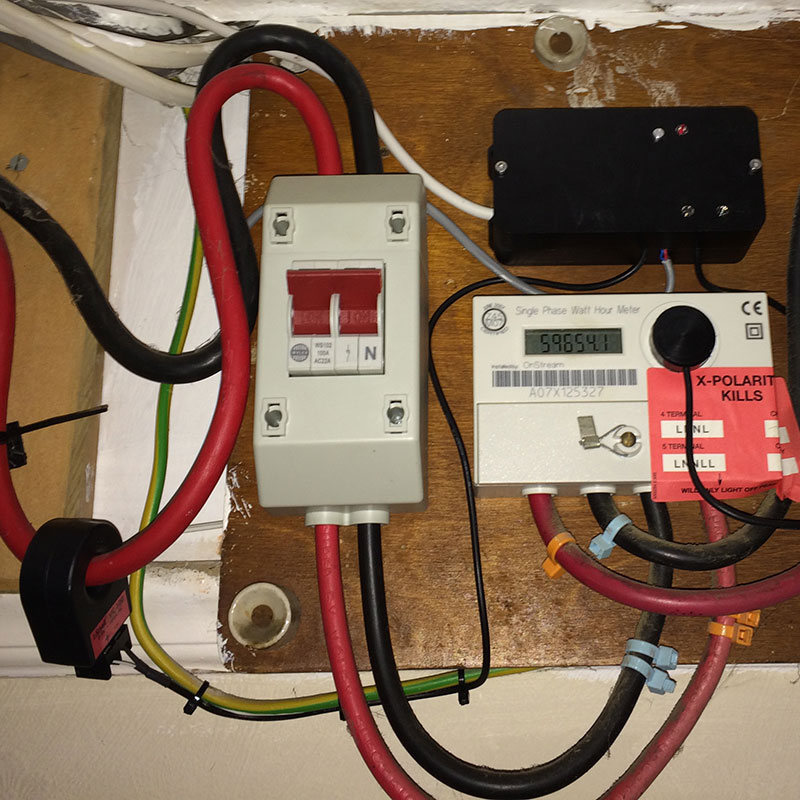
The mains current measurement was done with the same iSnail current sensor that we used on the previous logger. This gives a 0-5V output so we used a voltage divider to half the voltage and then fed it into an ADS1115 16-bit ADC from Texas Instruments. The ADS1115 is an I2C-based device and has four input channels although we only ended up using one.
The mains electric meter that is installed in our house has an LED on the front that blinks once for every Wh of energy that is used. To monitor the blinking LED we used a phototransistor fitted inside a small plastic case that is glued to the front of the electric meter. The phototransistor then connects to a SN74AUP1G17 Schmitt trigger which connects to one of the input pins on the ESP8266. We decided to use a Schmitt-trigger as the wire from the phototransistor would be running past the mains cables and could pick up stray noise so by passing it through a buffer the input to the EPS8266 would be a clean logic-level signal. The output from the buffer also drives an LED so we can see still when the LED on the electric meter is blinking now that it is covered by the sensor.
The gas meter is mechanical and has a small magnet fitted to a disk that spins when gas is passing through the meter. We managed to find an official sensor designed to fit the gas meter that consists of a reed switch in a plastic box.
To interface the reed switch with the energy monitor we used the same Schmitt-trigger and LED circuit as on the electric meter input.
To ensure the meter readings stay accurate in the event of a power cut or brownout we decided that the values for the gas and electric meters would be stored in an external FRAM. We chose the use a FRAM device as the internal flash memory on the ESP8266 is only designed to take a limited number of write cycles and we wanted to save the values to non-volatile ram on every update. FRAM can take up to a trillion read/write cycles and has a data retention of 150 years during a power cut so it should easily last long enough without failing. We used an FM24CL04B 4Kb FRAM from Cypress, this is I2C based so it sits on the same data bus as the ADC.
One issue we found while designing the circuit was the ESP-12 modules that we bought from China are counterfeit versions and the pinouts are slightly different to the official ESP-12 modules. One of the differences is the I2C pins are backward so SCL is connected to SDA and SDA is connected to SCL. To make the circuit compatible with the official boards and the ones we already bought we added a pair of jumpers onto the bottom of the PCB that would allow us to connect the I2C pins in both directions. An extra LED was added to the circuit that we set to flash every time an ADC sample is taken so we can easily see that the data logger is working.
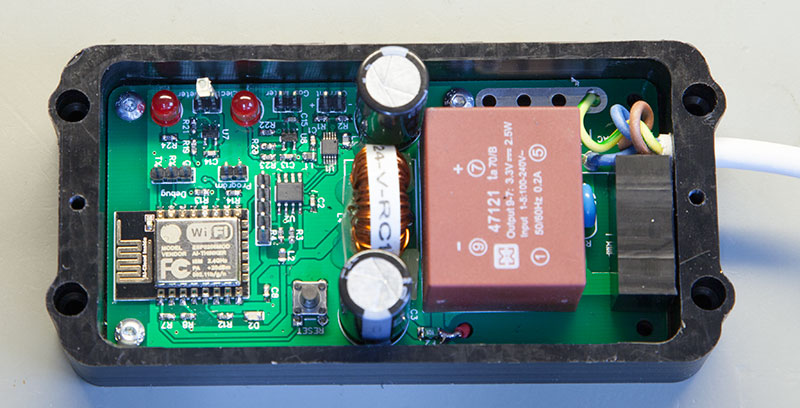
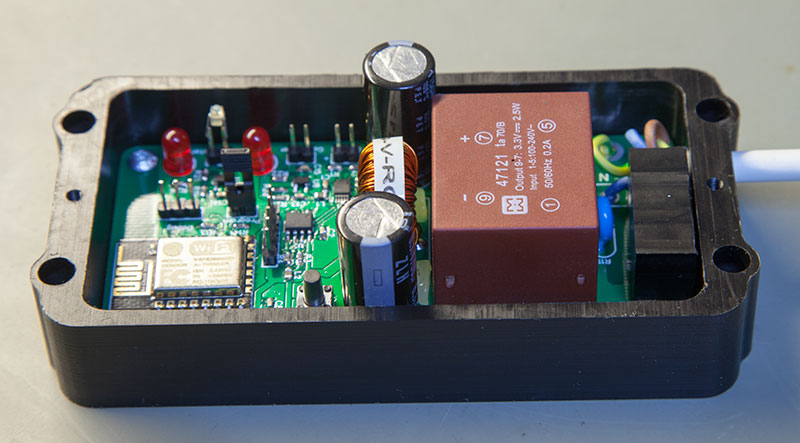
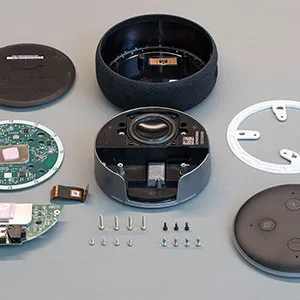
The circuit is fitted onto a 10cm x 5cm PCB with the power supply taking up half of the space. The ESP-12 module sits at the end of the PCB with all of the inputs down one side. A case was machined from a piece of 20mm thick Delrin. To get the light from the LEDs on the PCB to the outside of the case we used some 5mm round clear acrylic rods to make some light pipes that guide the light from the LEDs to the front of the case. A reset button extender was also cut from some aluminium rods.
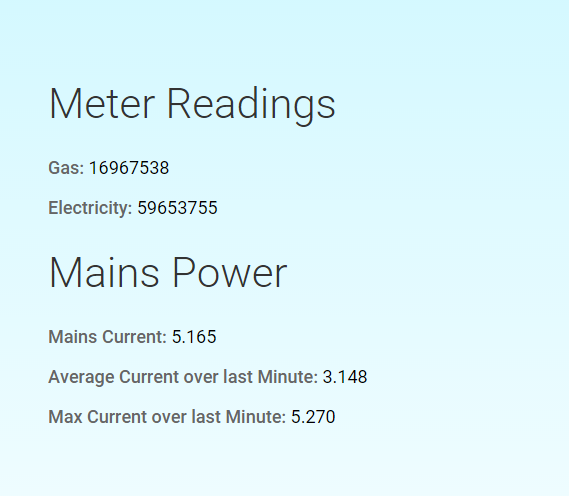
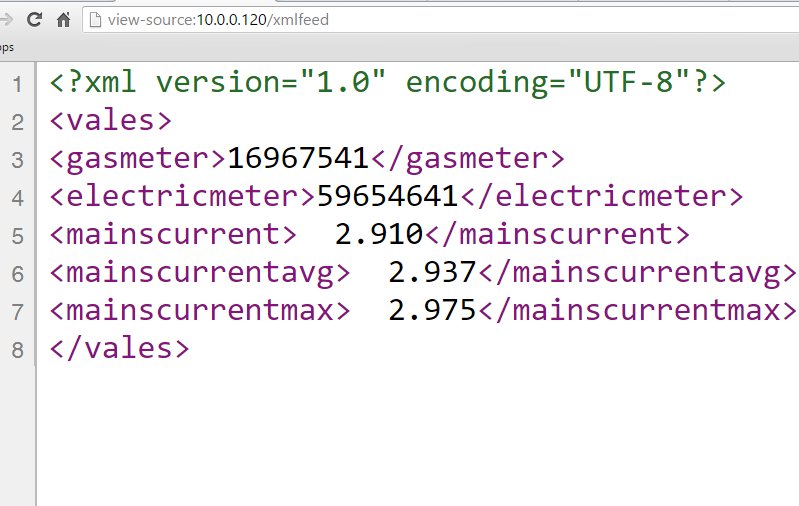
The software was designed in Visual Studio 2015 using the Visual Micro plugin which allowed us to write the Arduino-based code in an IDE that is far more user-friendly than the normal Arduino editor. The code is basically a web server that allows you to view the various data on a web page or return an XML feed with the same data values. The ADC is sampled once a second and stored in an array of 60 samples allowing us to average the current usage over a minute. Interrupts were used for the gas and electric meter inputs which increment the variables for each meter and then set a flag to tell the main program loop to save the values to FRAM on its next loop.
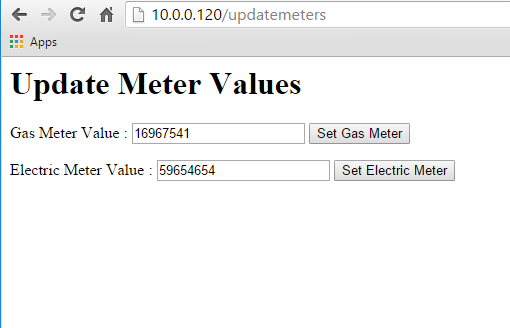
The values returned on the XML feed are the meter readings for the gas and electric meter, the mains current usage at the time of the reading, the average current value over the last minute and the maximum current value for the last minute. A web page was also added for updating the gas and electric values for when the data logger is originally set up, and if it goes out of sync with the gas meter due to a power cut.
We are using the Raspberry Pi on our solar logger to read the XML feed from the mains monitor once a minute and upload that to our web server. We did look at uploading the data directly from the ESP8266 but decided against it as we occasionally change the web address of the processing page on the webs server and it is easier to update a script on the Raspberry Pi rather than flashing the firmware on the mains data logger which involves balancing on a chair with a laptop and the debug interface while trying to press the reset button on the data logger and hit the upload button on the laptop at the same time.
The schematic, PCB files, CAD drawings for the case and firmware can be downloaded from my GitHub page: https://github.com/briandorey/ESP8266-Mains-Energy-Monitor

David
I want to buy it. Please contact.
Bob Burkett
Is you project available as a kit?
Thanks!
~Bob
Brian
Bob, I am sorry but I don't have the parts available as a kit but you can download the design and pcb files from the github link above and order the PCBs online.
lamalas
Would have been nice if it not only measured current (as that is an useless measurement in itself for AC), but measured proper energy consumption by measuring the voltage too. If you have a pure inductive load, you could have 10A flowing yet consume 0Wh of energy, as the current's phase is 90 degrees lagging behind the voltage.